
Fang Announces Fourth Quarter and Fiscal Year Results
BEIJING, Feb. 25, 2016 -- SouFun Holdings Limited (NYSE: ) ("Fang"), the leading real estate Internet portal in China, announced today its unaudited financial results for the fourth quarter and fiscal year ended December 31, 2015.
Fourth Quarter 2015 Highlights
- Total Revenue increased by 35% year-on-year to $300.7 million. Revenue from e-commerce services increased by 76% year-on-year to $173.8million.
- Operating loss was $32.6 million. Non-GAAP operating loss was $31.7 million. A description of the adjustments from GAAP to non-GAAP operating income is set forth below.
- Net loss attributable to SouFun's shareholders was $38.8 million.
- Non-GAAP net loss attributable to SouFun's shareholders was $68.9 million, a $0.16 loss per fully-diluted earnings ADS.
- GMV increased by 28% from $10.6 billion in the third quarter of 2015 to $13.5 billion in the fourth quarter. The following table shows GMV by quarter for 2015.
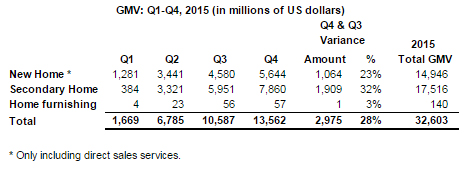
"2015 was the first year of our transformation and the 35% revenue growth for Q4 is encouraging." Said Vincent Mo, Chairman and CEO of Fang.com. "We are especially proud of our performance in resale market with leading market positions in over 10 major cities in China and GMV over $17 billion. We will continue and deepen our transformation in 2016 and we are confident that 2016 will be the start of a series of rewarding years."
Fourth Quarter 2015 Results
Revenues
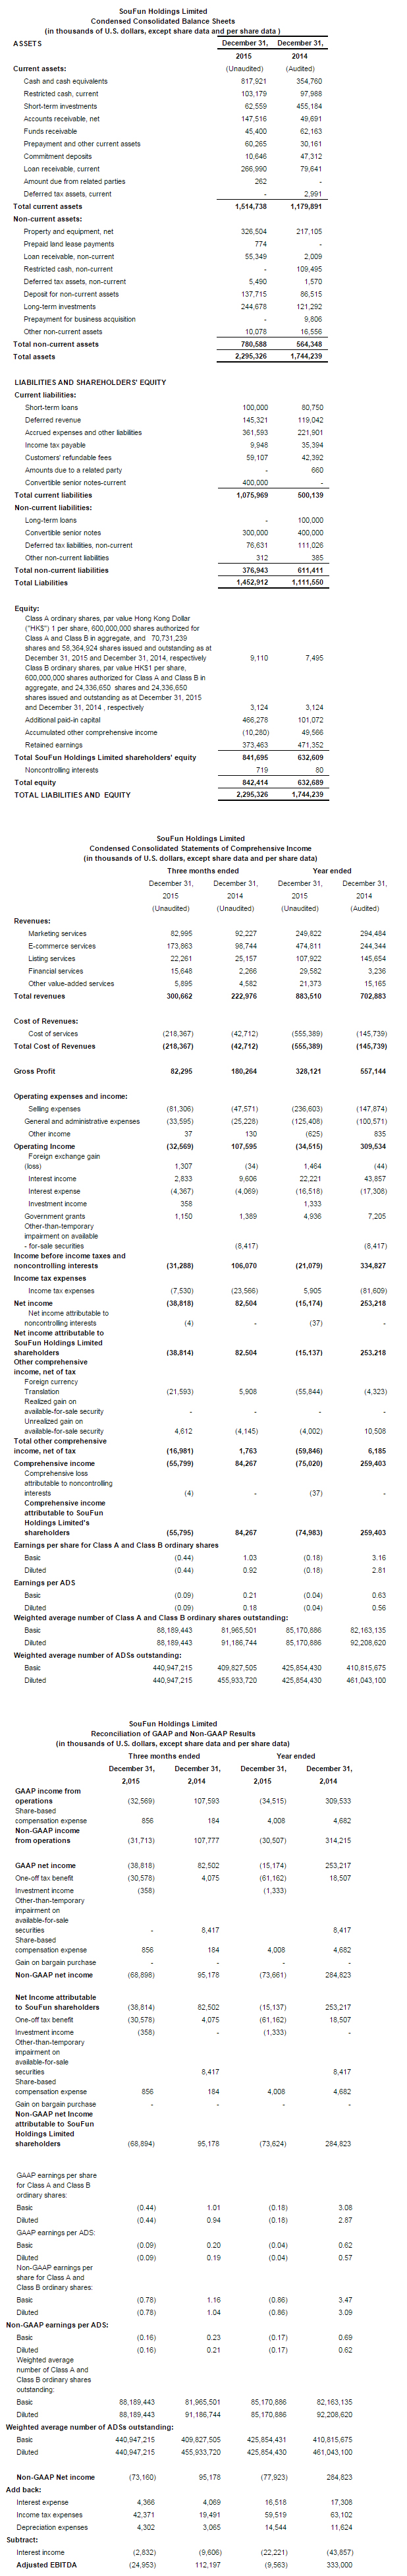
Fang reported total revenues of $300.7 million for the three months ended December 31, 2015, representing an increase of 34.8% from $223.0 million for the corresponding period in 2014, primarily driven by the growth in e-commerce services, partially offset by the decline in marketing services and listing services.
Revenue from marketing services was $83.0 million for the three months ended December 31, 2015, a decrease of 10.0% from $92.2million for the corresponding period in 2014, primarily due to fewer customers in the market and fewer average amount per advertising contract.
Revenue from e-commerce services was $173.9 million for the three months ended December 31, 2015, a 76.1% increase from $98.7 million for the same period in 2014, primarily due to the growth of the direct sales services for new home, the growth of the real estate brokerage services for secondary home and the growth of the rental, as well as rapid growth of the home decorating services.
Revenue from listing services was $22.3 million for the three months ended December 31, 2015, a decrease of 11.5% from $25.2 million for the corresponding period in 2014, primarily due to our reduction of unit price per paying subscriber.
Revenue from financial services was $15.6 million for the three months ended December 31, 2015, an increase of 590.6% from $2.7 million for the corresponding period in 2014. Fang began to offer financial services in August 2014. We extracted revenue from financing services from other value-added services, to show this is a separate revenue source starting from the first quarter of 2015.
Revenue from other value-added services was $5.9 million for the three months ended December 31, 2015, an increase of 28.7% from $4.6 million for the corresponding period in 2014, primarily due to the rapid growth of our research related products.
Cost of Revenue
Costs of revenue was $218.4 million in the three months ended December 31, 2015, an increase of 411.0% from $42.7 million for the corresponding period in 2014. The increase in cost of revenue was mainly attributable to increased staff. In addition, increased e-commerce cost included potion of proceeds remitted to real estate brokers and subsidies to home buyers related to e-commerce services, and increased decorating cost related to the home decorating services also contributed to the increase in cost of revenues.
Gross margin was 27.4% in the three months ended December 31, compared with 2015, 2014 over the same period was 80.8%.
Operating Expenses
Operating expenses were $114.9 million for the three months ended December 31, 2015, an increase of 57.8% from $72.8 million compare to the fourth quarter of 2014.
Selling expenses were $81.3 million for the three months ended December 31, 2015, an increase of 70.9% from 47.6 million for the corresponding period in 2014, primarily due to increased expenses paid to our advertising and promotional expenses and depreciation expense.
General and administrative expenses were $33.6 million for the three months ended December 31, 2015, an increase of 33.2% from $25.2 million for the corresponding period in 2014, primarily due to increased operating lease and increased professional service fee.
Operating Income/Loss
Operating loss was $32.6 million for the three months ended December 31, 2015, compared to operating income of $107.6 million for the corresponding period in 2014.
Income Tax Expenses
Income tax expense was $7.5 million for the three months ended December 31, 2015, compared to income tax expenses of $23.6 million for the corresponding period in 2014.
Net Income/Loss and EPS
Net Loss was $38.8 million for the three months ended December 31, 2015, compared to net income $82.5 million for the corresponding period in 2014. A $0.44 and $0.09 loss per fully-diluted ordinary share and ADS, respectively, for the three months ended December 31, 2015, compared to $0.94 and $0.19 for the corresponding period in 2014.
Adjusted EBITDA
Adjusted EBITDA, defined as non-GAAP net income before income taxes, interest expenses, interest income, depreciation and amortization, was $25.0 million loss for the three months ended December 31, 2015, compared to $112.2 million income for the corresponding period in 2014.
Cash
As of December 31, 2015, SouFun had cash, cash equivalents, and short-term investments of $880.5 million, compared to $622.0 million as of September 30, 2015. Net cash used in operating activities was $31.6 million for the quarter ended December 31, 2015, compared to net cash generated in operating activities $5 million for the same period in 2014. The decline in cash flows from operating activities was primarily due to a $37.1 million decrease in cash flows due to the increase of loans receivables provided to home buyers under our financial services program and 21.1 million increase in cash flow due to increase of customers' refundable fees, which was partially offset by the increase in defer revenue of 35.0 million in the fourth quarter of 2014.
Fiscal Year 2015 Results
Revenues
Fang reported total revenues of $883.5 million for 2015, representing an increase of 25.7% from $702.9 million for 2014, primarily driven by the growth in e-commerce services and financial services.
Revenue from marketing services was $249.8 million for 2015, a decrease of 15.2% from $294.5 million for 2014, primarily due to fewer customers in the market and fewer average amount per advertising contract.
Revenue from e-commerce services was $474.8 million for 2015, a 94.3% increase from $244.3 million for 2014. The growth was primarily driven by the fast growth of our new e-commerce business.
Revenue from listing services was $107.9 million for 2015, a decrease of 25.9% from $145.7 million for 2014, primarily due to our reduction of unit price per paying subscriber.
Revenue from financial services was $29.6 million for 2015, an increase of 814.2% from $3.2 million for 2014, primarily due to the rapid growth of our financial services and research related products.
Revenue from other value-added services was $21.4 million for 2015, an increase of 40.9% from $15.2 million for 2014, primarily due to the rapid growth of our research related products.
Cost of Revenue
Cost of revenue was $555.4 million for 2015, an increase of 281.1% from $145.7 million 2014. The increase in cost of revenue was mainly driven by our new e-commerce model, increased staff costs, as well as an increase in VAT taxes and surcharges.
Gross margin was 37.1% for 2015, compared to 79.3% for the corresponding period in 2014.
Operating Expenses
Operating expenses were $362.0 million for 2015, an increase of 45.7% from $248.4 million for 2014.
Selling expenses were $236.6 million for 2015, an increase of 60.0% from $147.9 million for 2014, primarily due to the new e-commerce model, increased advertising and promotional expenses and staff cost.
General and administrative expenses were $125.4 million for 2015, an increase of 24.7% from $100.6 million for 2014, primarily due to increased staff costs.
Operating Income/Loss
Operating loss was $34.5 million for 2015, compare to operating income of $309.5 million for 2014.
Income Tax Benefit/Expenses
Income tax benefit was $5.9 million for 2015, compared to $81.6 million of income tax expenses for the corresponding period in 2014. The income tax benefit was primarily due to the reversal of withholding tax arising from the undistributed earnings.
Net Loss/Income and EPS
Net loss attributable to Fang’s shareholders was $15.2 million for 2015, compared to $253.2 million for the corresponding period in 2014. A fully diluted earnings per ADS was loss of $0.04 for 2015, compared to income of $0.57 for 2014.
Adjusted EBITDA
Adjusted EBITDA, defined as non-GAAP net income before income taxes, interest expenses, interest income, depreciation and amortization, was $9.6 million loss for 2015, compared to $333.0 million income for 2015.
Cash
Cash used in operating activities was $165.4 million for 2015, compared to net cash generated in operating activities $214.4 million for 2014. The decline in cash flows from operating activities was primarily due to a $240.7 million decrease in cash flows due to the increase of loans receivables provided to home buyers under our financial services program.
Business Outlook
Fang estimates its total revenue guidance for 2016 around $1,060.2 million, representing a year-on-year increase of 20.0%. This forecast reflects Fang's current and preliminary view, which is subject to change.
Adoption of Repurchase Program
The Company also announced that it has adopted a share repurchase program (the "Repurchase Program"), pursuant to which the Company may elect to repurchase the issued and outstanding American depositary shares of the Company with an aggregate value of no more than US$200 million within a period of 12 months.
The Resignation of Richard Jiangong Dai
The Company would also like to announce that Mr. Richard Jiangong Dai resigned from his position as a member of the Board of Director. He plans to focus on other professional commitments. "I would like to thank Mr. Richard Jiangong Dai for his contribution to Fang," commented Mr. Vincent Mo. "I and the rest of the board would like to take this opportunity to express our sincere gratitude to Mr. Richard Jiangong Dai and wish him the best in his pursuit of his other professional commitments."
Conference Call Information
Fang's management team will host a conference call at 8:00 AM U.S. EST (9:00 PM Beijing/Hong Kong time). The dial-in details for the live conference call are:
|
International Toll: |
+65 6713-5090 |
|
|
Local Toll: |
||
|
United States |
+1 845-675-0437 / |
+1 866-519-4004 |
|
Hong Kong |
+852 3018-6771 |
+852 800-906-601 |
|
Mainland China |
+86 400-620-8038 |
+86 800-819-0121 |
|
Passcode: |
SFUN |
|
A telephone replay of the call will be available after the conclusion of the conference call from 11:00 ET on February 25 through 23:59 ET March 4, 2016. The dial-in details for the telephone replay are:
|
International Toll: |
+61 2-8199-0299 |
|
|
Toll-Free: |
||
|
United States |
+1 855-452-5696 |
+1 646-254-3697 |
|
Hong Kong |
+852 800-963-117 |
+852 3051-2780 |
|
Mainland China |
+86 400-602-2065 |
+86 800-870-0205 |
|
Conference ID: |
52958132 |
A live and archived webcast of the conference call will be available on Fang's website at http://ir.fang.com.
About Fang
Fang operates the leading real estate Internet portal in China in terms of the number of page views and visitors to its websites. Through our websites, we provide marketing, e-commerce, listing and other value-added services for China's fast-growing real estate and home furnishing and improvement sectors. Our user-friendly websites support active online communities and networks of users seeking information on, and other value-added services for, the real estate and home furnishing and improvement sectors in China.Fang currently maintains about 100 offices to focus on local market needs and its website and database contains real estate related content covering more than 320 cities in China. For more information about Fang, please visit http://ir.fang.com.
Safe Harbor Statements
This press release contains forward-looking statements within the meaning of Section 27A of the Securities Act of 1933, as amended, and Section 21E of the Securities Exchange Act of 1934, as amended. Such forward-looking statements are made under the "safe harbor" provisions of the U.S. Private Securities Litigation Reform Act of 1995.
These forward-looking statements can be identified by terminology such as "will," "expects," "is expected to," "anticipates," "aim," "future," "intends," "plans," "believes," "are likely to," "estimates," "may," "should" and similar expressions. Such forward-looking statements include, without limitation, statements regarding the proposed transactions contemplated by the Restructuring and the Concurrent Share Placement. Statements that are not historical facts, including statements about Fang's beliefs and expectations, are forward-looking statements. Forward-looking statements involve inherent risks and uncertainties. A number of important factors could cause actual results to differ materially from those contained in any forward-looking statement. Potential risks and uncertainties include, without limitation, whether the transactions contemplated by the Restructuring will receive the requisite approvals, whether the Restructuring will be carried out as planned, the impact of the Restructuring on the Fang Assets, the impact of Fang's transformation from a pure Internet information platform to a transaction-oriented platform, the impact of Fang's implementation of a "zero tolerance policy" that has resulted in dismissal of employees, the impact of the slowdown in China's real estate market on Fang and the impact on revenues of our existing and new service fees reductions, the ability of Fang to retain real estate listing agencies as customers during challenging economic periods, the success of Fang's new business initiatives, the ability of Fang to manage its operating expenses, the impact of, measures taken or to be taken by the Chinese government to control real estate growth and prices and other events which could occur in the future, economic challenges in China's real estate market, the impact of competitive market conditions for our services, our ability to maintain and increase our leadership in China's home related internet sector, the uncertain regulatory landscape in China, fluctuations in our quarterly operating results, our continued ability to execute business strategies including our Fang membership services and Fang Online Shop, our ability to continue to expand in local markets, our reliance on online advertising sales and listing services and transactions for our revenues, any failure to successfully develop and expand our content, service offerings and features, including the success of new features to meet evolving market needs, and the technologies that support them, the quality of the loans we originate and resell and the performance of those loans in the future, our ability to successfully service and process customer loans for our own benefit and for the purchasers of those loans and, should we in the future make acquisitions, any failure to successfully integrate acquired businesses.
For investor and media inquiries, please contact:
Mr. Kent Cangsang Huang
CFO
Phone: +86-10-5631-9668
Email: huangcangsang@fang.com
SOURCE SouFun Holdings Limited